Overview Page
The Overview tab for a project has high level, aggregated information about your project.
Issue Summary
The Issue Summary shows metrics for all of the issues on the project. It includes a breakdown by issue status, information about issue aging, a plot of when issues were entered and closed over time, as well as a table showing information about each company that has issues assigned to them on the project.


Work Summary
The Work Summary provides high level insight for the project, and gives you tools to quickly understand the status. It also allows early identification of potential problem areas.

 Work Matrix
 Work Matrix
The work matrix shows the project and all equipment and the work progress associated with them in a matrix format. 
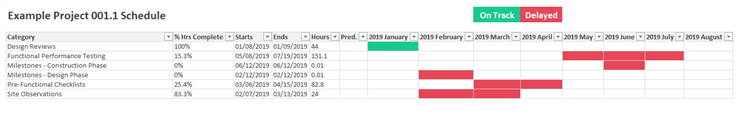
Project Schedule
The project schedule is automatically generated when viewing the Overview tab for a project. The project schedule can also be exported to a formatted .xlsx file by using the Export button. Use the export option to share the schedule or further manipulate the data.
The granularity of the data being displayed (and subsequently exported) can be adjusted using the dropdown menus above the schedule. After setting the menus, use the Refresh button to update the schedule based on your criteria.

An .xlsx export will use the criteria you have selected in these dropdown menus.
After clicking on the dates or Details links, you can make bulk edits to the work items:

Work can also be scheduled in bulk for the entire project on the Work > Detailed page, as well as by using the configuration form. Review the article Working with Configuration Forms for more information.
The project schedule, as well as due dates for work and systems, can be hidden from view by setting the “Hide Schedule and Due Dates” option on the Settings tab for a project.
 Work Category Table
 Work Category Table
The Work Category table provides additional information about the work on the project. The table consist of an aggregation of all work items into their respective categories, along with a breakdown of the progress of the work in each category is shown. The percentages are based on work item hours, and the quantities, shown as (n) represent the quantity of work items.
